Project idea
The code takes CSV files located in the private_swedish_mind/data/.
Each file represents data for a journey.
The files have the following format:
idx |
timestamp |
geometry_gps_csv |
geometry_mpn_csv |
|---|---|---|---|
0 |
2019-05-23 13:50:00 |
[1541218.350, 8117969.018] |
[1546361.310, 8122021.062] |
1 |
2019-05-23 14:30:00 |
[1542727.347, 8114445.220] |
[1542862.167, 8117797.551] |
… |
… |
… |
… |
1048 |
2017-11-21 22:35:00 |
[2090807.250, 8330158.612] |
[2088342.514, 8331062.918] |
where geometry_gps_csv and geometry_mpn_csv are the coordinates according to GPS and MPN correspondingly in the EPSG=3857 projection.
Next, data is undergoing the following transformation:
the data are being cut by the given bounding area
the bounding area is being tesselated by Voronoi polygons with antennas as their centers
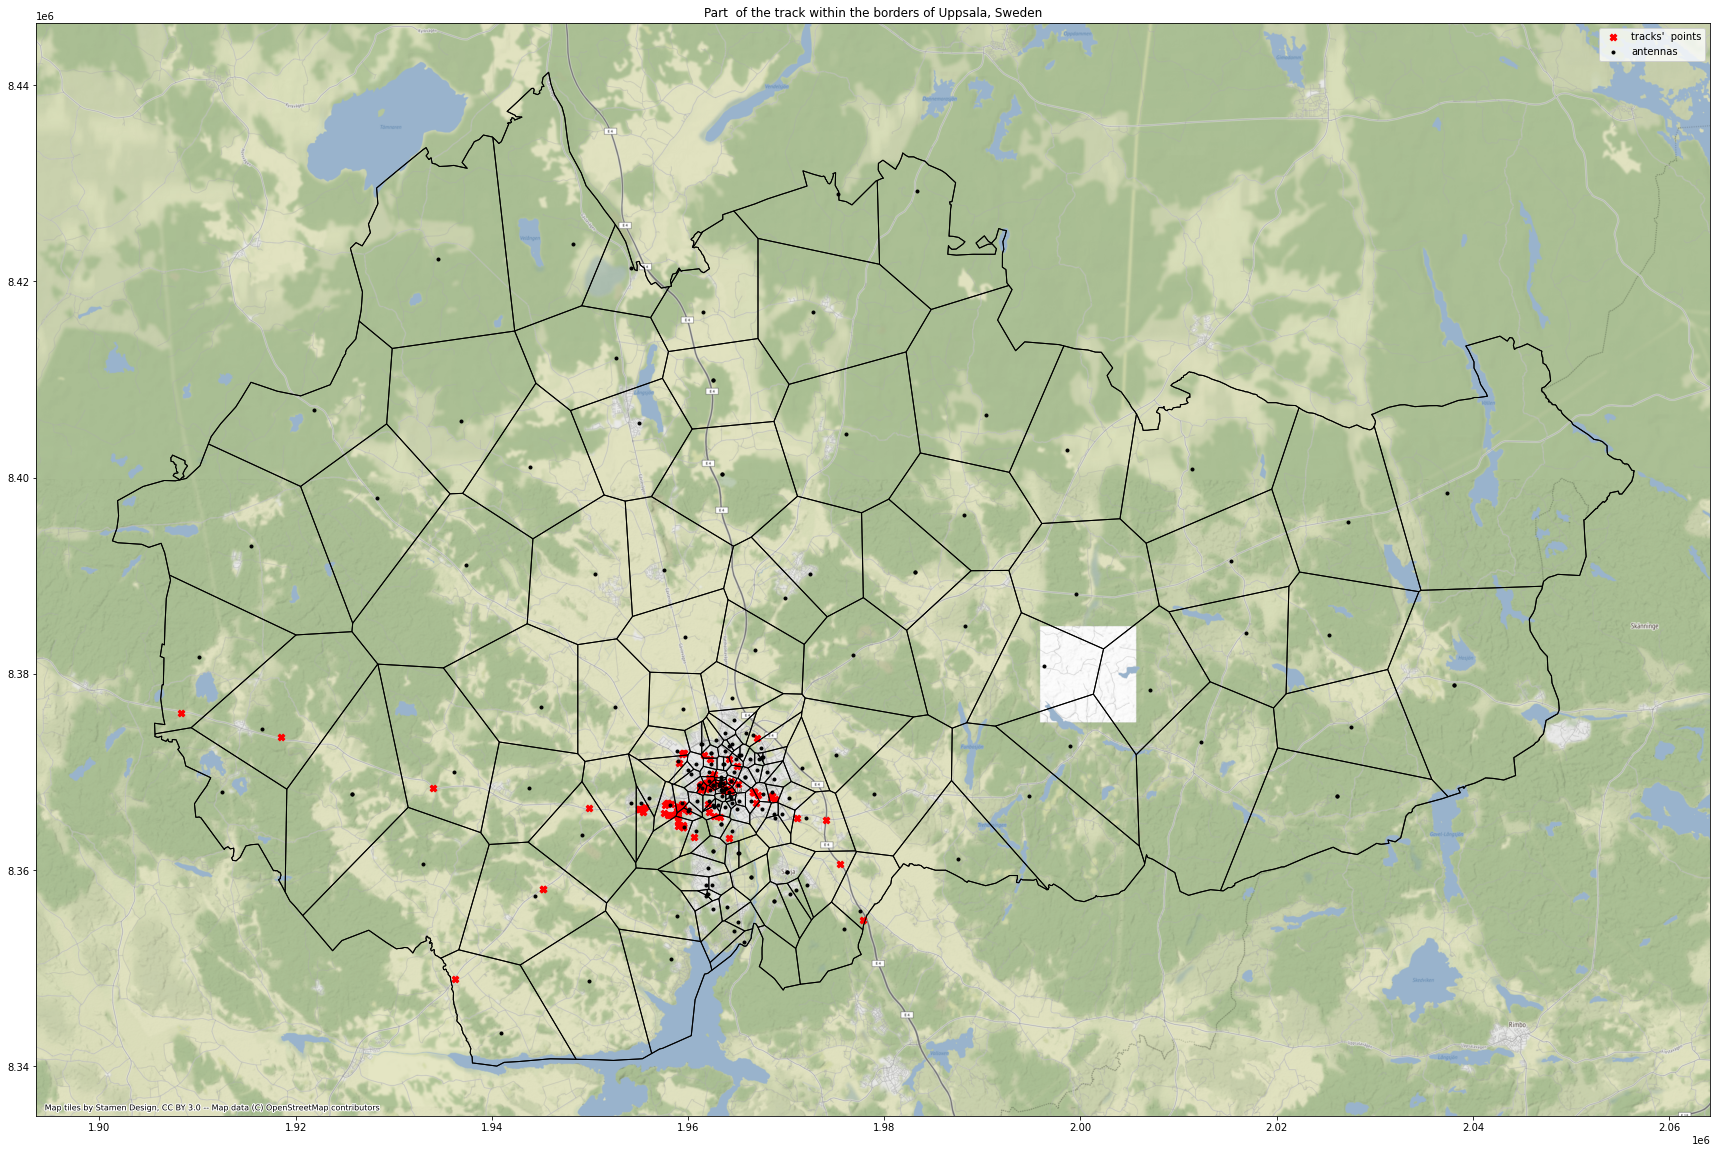
for each GPS position, geometry_gps_csv we identify to which Voronoi cell it belongs to and consider it as a base cell
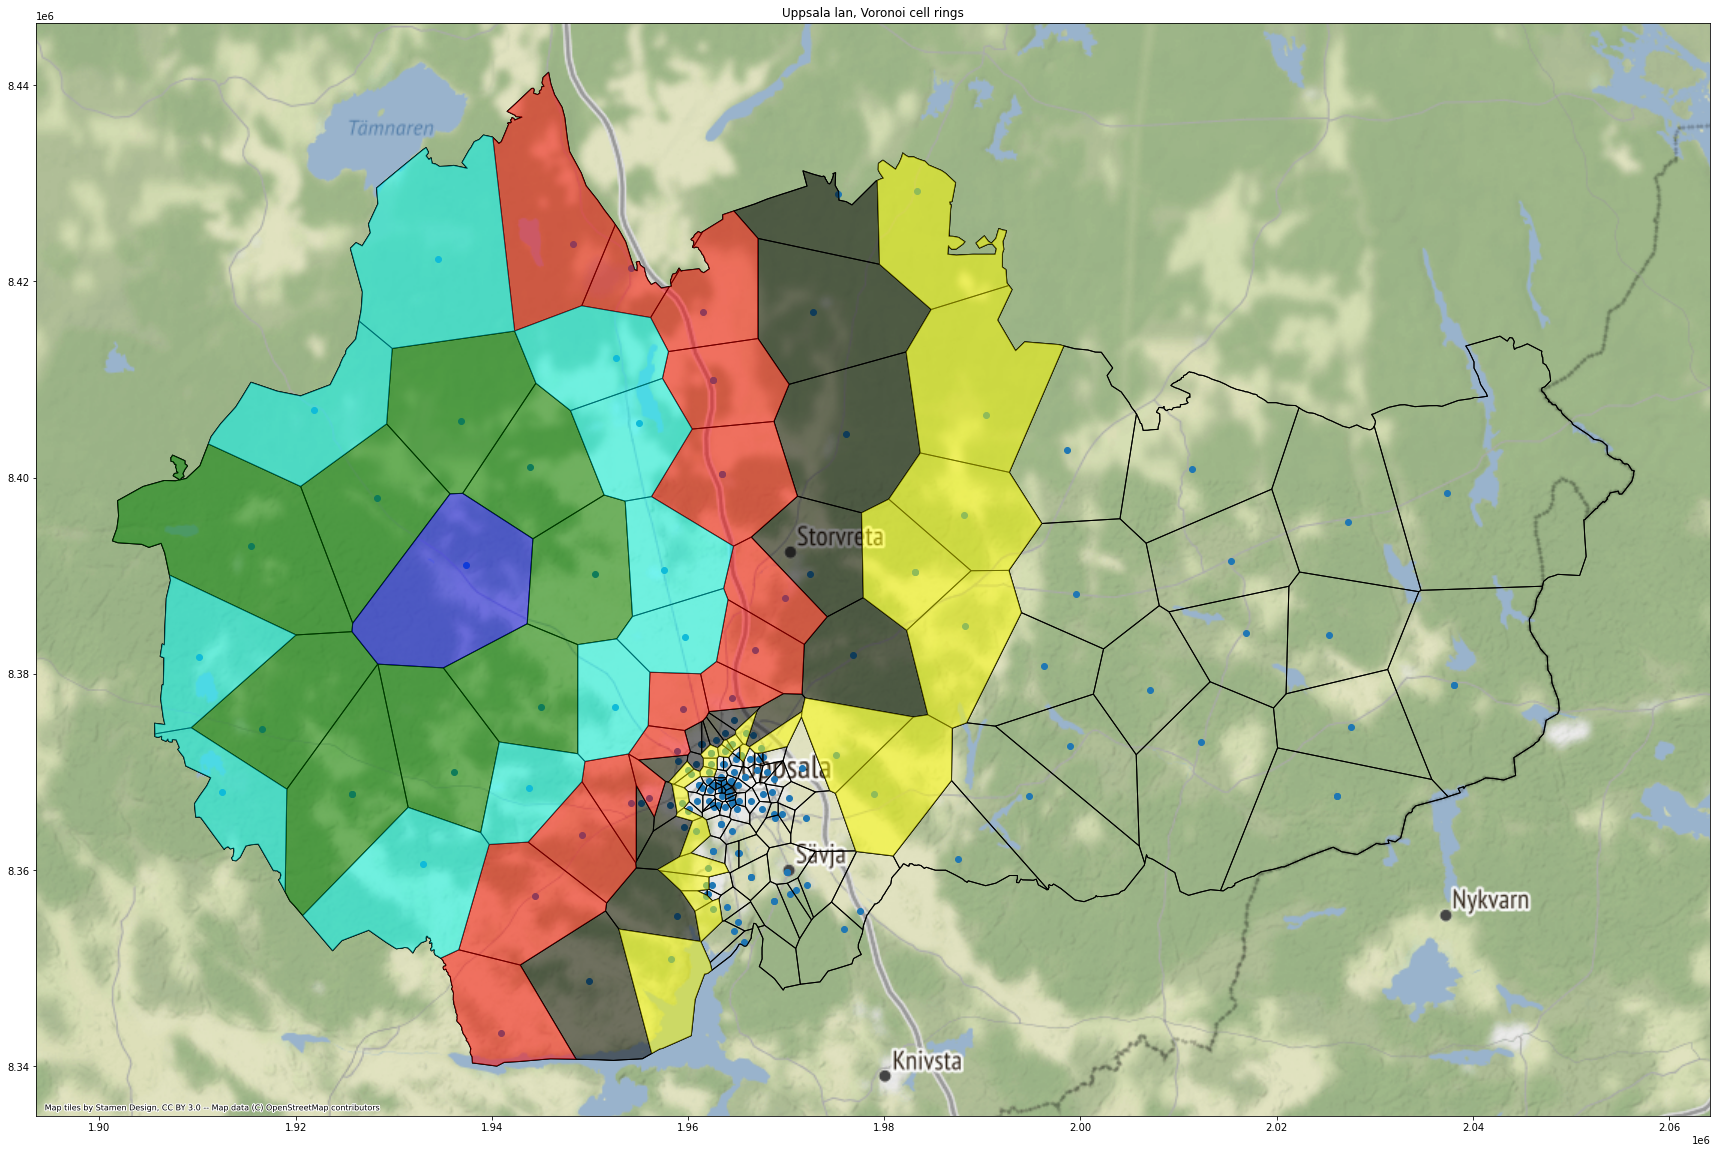
for each base cell we build the rings of Voronoi cells, as the year rings for the tree. In the picture below the blue color shows the base cell, while the ‘green’, ‘cyan’, ‘red’, ‘black’ define the colors for the rings of the next level.
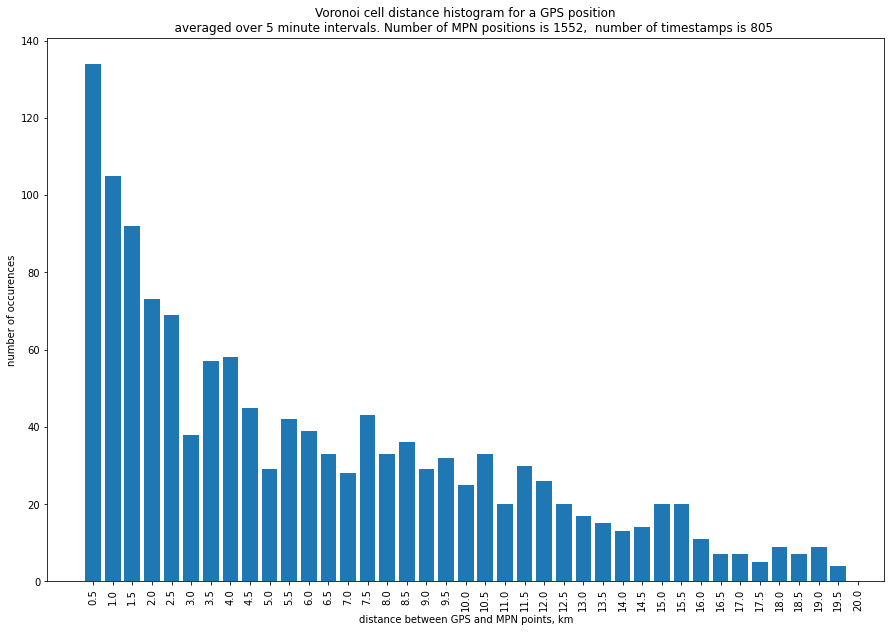
for each geometry_gps_csv we build cell rings and for corresponding geometry_mpn_csv figure out to which ring layer it falls into. Based on that we build a histogram for the layer occurancies after moving through the table.
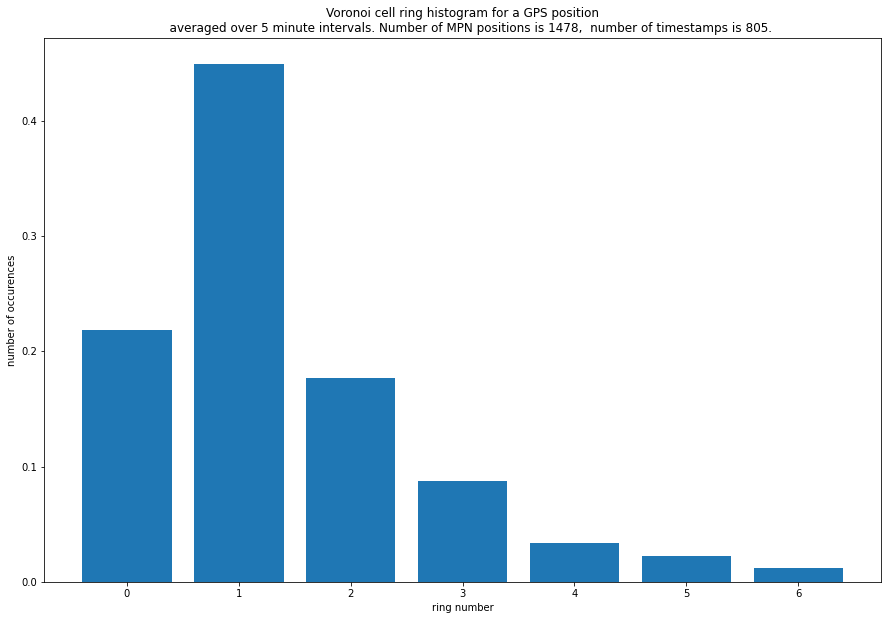
The number for ring=0 tells the number of times when the GPS and MPN positions fall into the same Voronoi cell. The number for ring=1 shows the number of times when MPN position is in the first layer, and so forth.